

Choose which services send maintenance reminders
You can now pick which services on a board should send scheduled maintenance reminders. No more reminders for services you don't care about on that specific board.
Each board now has a list of its services on the Maintenance Reminders tab (previously "Reminders"). Toggle a service off, and you won't receive any maintenance notification for it on that board, regardless of channel.
By default, every service stays on, so nothing changes for existing boards until you opt out.
How to set it up1. Open a board's Edit page.
2. Go to the Maintenance Reminders tab.
3. Below the reminder timing, find the Services list.
4. Flip the toggle for each service you want to silence, or use Enable all / Disable all to switch the whole list at once.
5. Click Save Reminders.
The selection is saved per board, so you can keep AWS maintenance reminders flowing to the engineering board while muting them everywhere else.
Manage tags on monitors via API
You can now read and update tags on your 3rd-party services and custom monitors directly through the API. Tags are returned on every list and detail endpoint, can be set when adding a service to a board, and can be replaced anytime with a PATCH request.
Useful when you want to sync labels from your infrastructure or IaC, automate board setup from scripts, or keep monitor metadata in sync with the rest of your tooling.
Full reference is on dev.isdown.app under 3rd-Party Monitors.
Clone Board
Setting up a new board just got faster. You can now clone any existing board and all 3rd-party services and website monitors are copied over instantly. Give it a name and it's ready to use.
Useful when you're managing multiple teams or clients with similar setups and don't want to start from scratch every time.
To try it, go to Settings → Manage Boards and click Clone next to any board
AWS Region Filter for Notifications
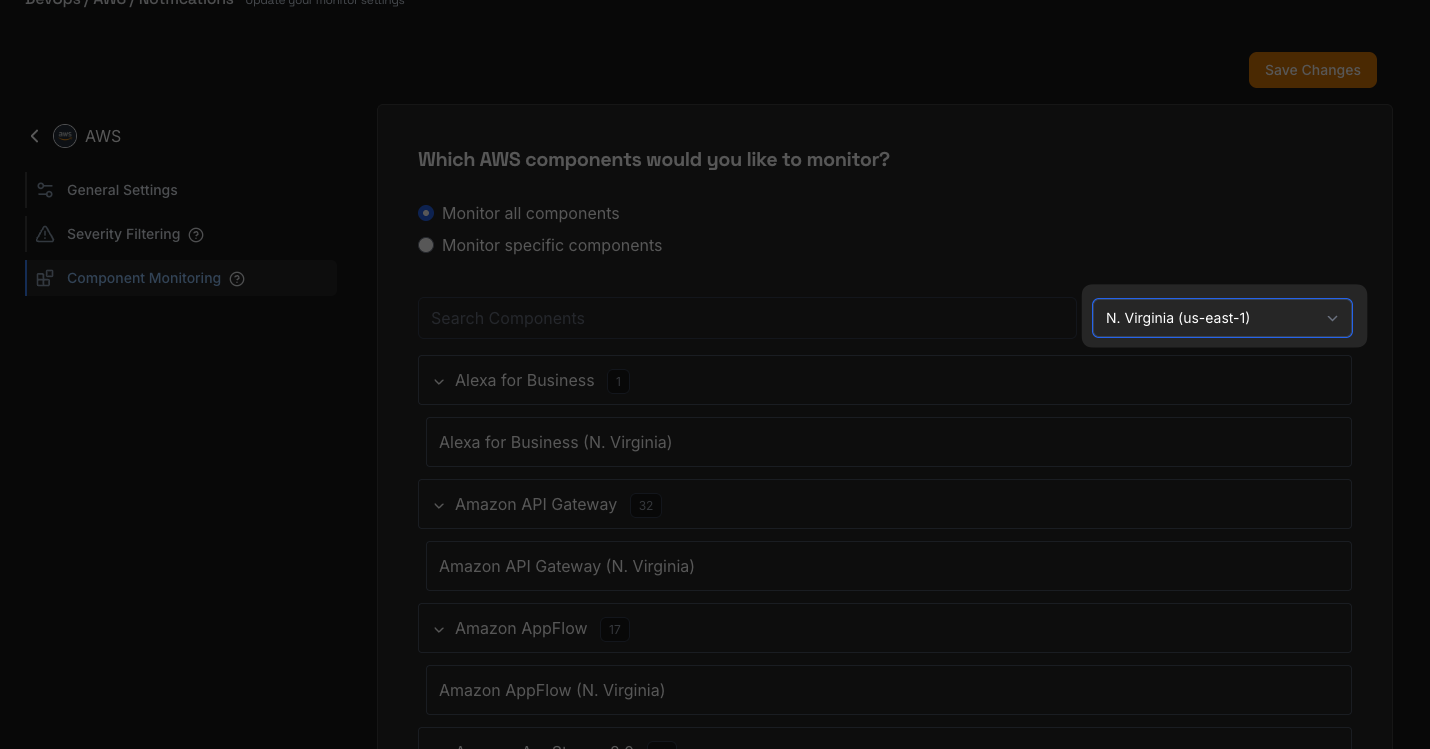
Finding the right AWS components to monitor just got easier. You can now filter by AWS region directly in the notifications view, so you only see the services and components that matter to your infrastructure.
The new region dropdown is organized by geographic group — US, Europe, Asia Pacific, and more — making it simple to zero in on the regions you actually use. Combine it with the existing search bar to quickly narrow down components by both name and region at the same time.
To try it out, head to any AWS service in your notifications settings and look for the new region filter dropdown next to the search bar.
If you're monitoring AWS services across multiple regions, this should save you a lot of scrolling.
Multi-Language Widget Status Messages
Your status page widgets are no longer English-only. You can now customize the three status messages — operational, degraded, and down — in any language you need.
Add as many languages as you want, set a default, and your widget will display the right message based on a simple ?lang= URL parameter. If a translation is missing, the widget falls back to the default language automatically.
To get started, edit any widget and scroll to the new Languages section. We've included pre-filled translations for 30+ languages (Spanish, Portuguese, French, German, Japanese, and more), so you won't have to start from scratch.
This was one of the most requested features on our feedback board — your widgets can now speak the same language as the website / app is being presented.
Manage Incidents via API
You can now create, update, and delete incidents on your custom services through the IsDown API.
This is useful if you want to trigger incidents programmatically, keep your status page in sync with your internal alerting tools, or build automated incident workflows without logging into IsDown.
The new endpoints let you open an incident, post updates as your team investigates, and resolve it when the issue is cleared. Full documentation is available at https://dev.isdown.app/endpoints/incidents.
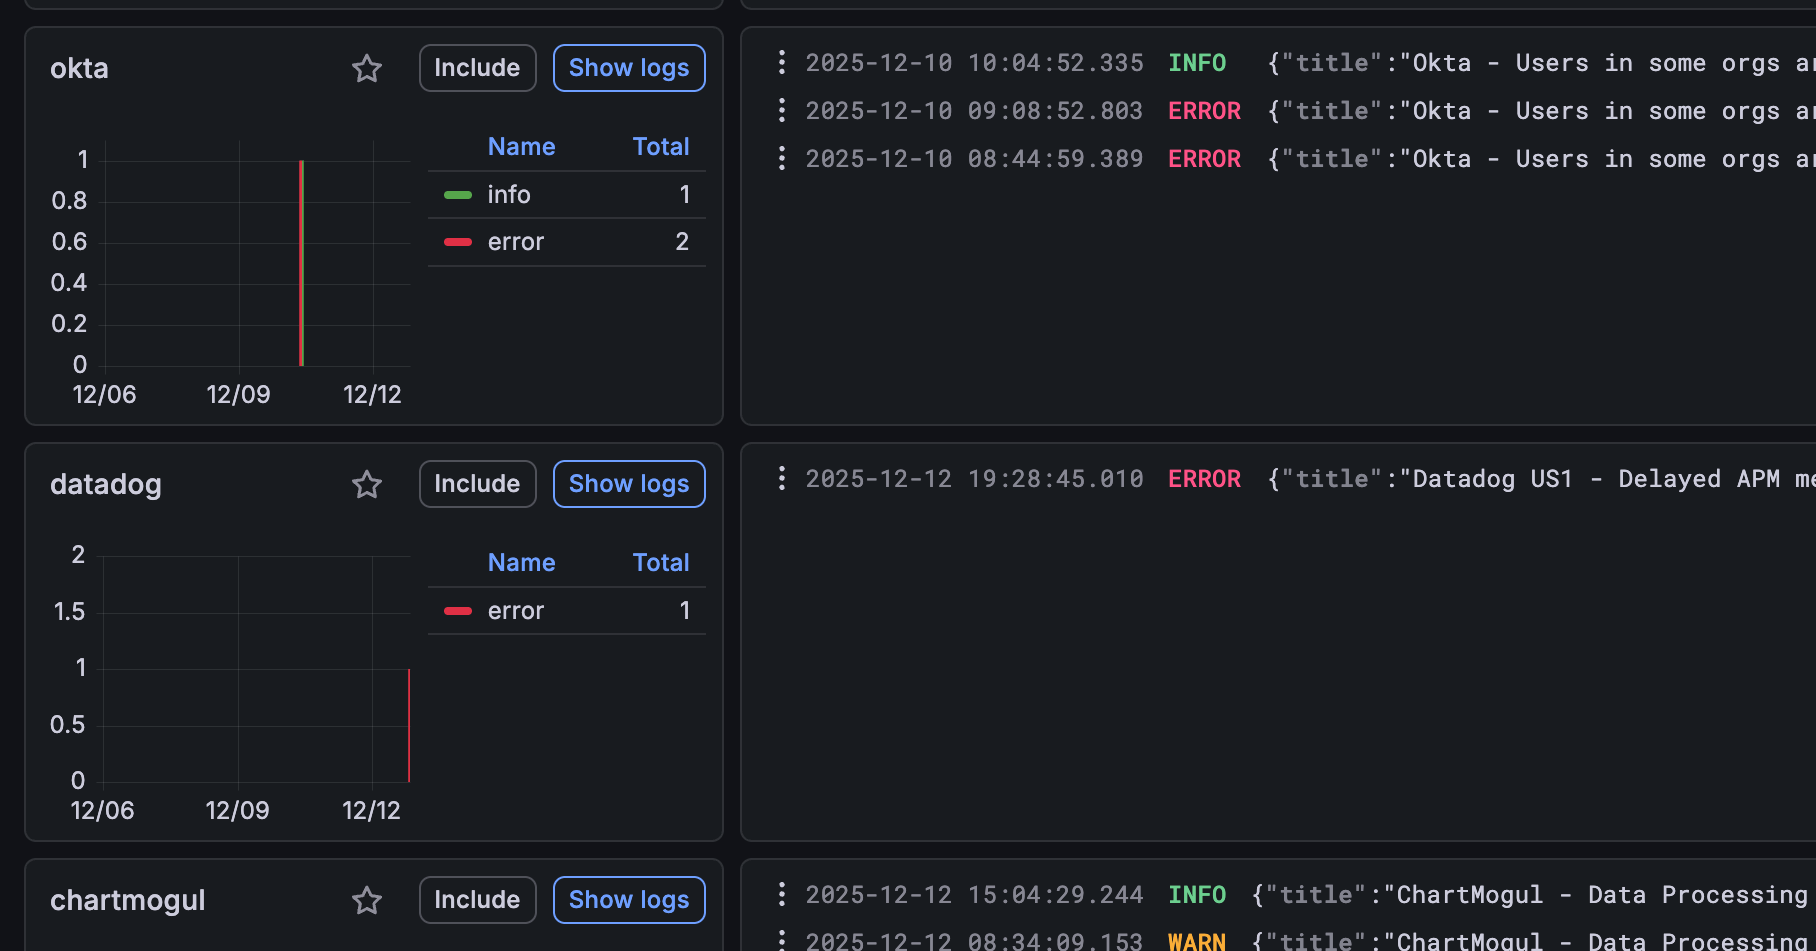
MCP Server: Query IsDown from AI Assistants
Stop switching between tabs to check if your services are healthy. We've built an MCP (Model Context Protocol) server so you can talk to IsDown directly from AI assistants like Claude.
Whether you're debugging an issue or just starting your day, you can now get instant status updates using natural language. It's like having a DevOps assistant who knows exactly what's happening with your stack.
What can you do? 🔧Ask your AI assistant things like:
-
"What services are currently experiencing issues?"
-
"Show me recent incidents for AWS"
-
"What's the status of my production board?"
The server gives your AI 6 read-only tools to fetch the data you need:
-
list_services— See all your monitored services. -
get_service_status— Check the health of a specific service. -
search_services— Quickly find a service by name. -
list_incidents— View and filter ongoing or past incidents. -
get_incident— Dig into the details of a specific event. -
list_boards— See all your custom status boards.
The MCP Server is available for our Enterprise customers. It only takes a few minutes to hook up to your workspace.
Ready to try it? Check out the setup guide →
Grafana Integration now Available
Now you can send all the outages from your third-party services and website monitors right to your Grafana instance. We will send updates when the outage starts and when it resolves.
It's now available in the Alerts & Integrations screen. Just set it up and wait for the outages to start flowing.
For instructions on how to set it up, go to https://help.isdown.app/integrations/how-to-set-up-grafana
If you have any feedback, we would love to hear it!
Organize your Status Page
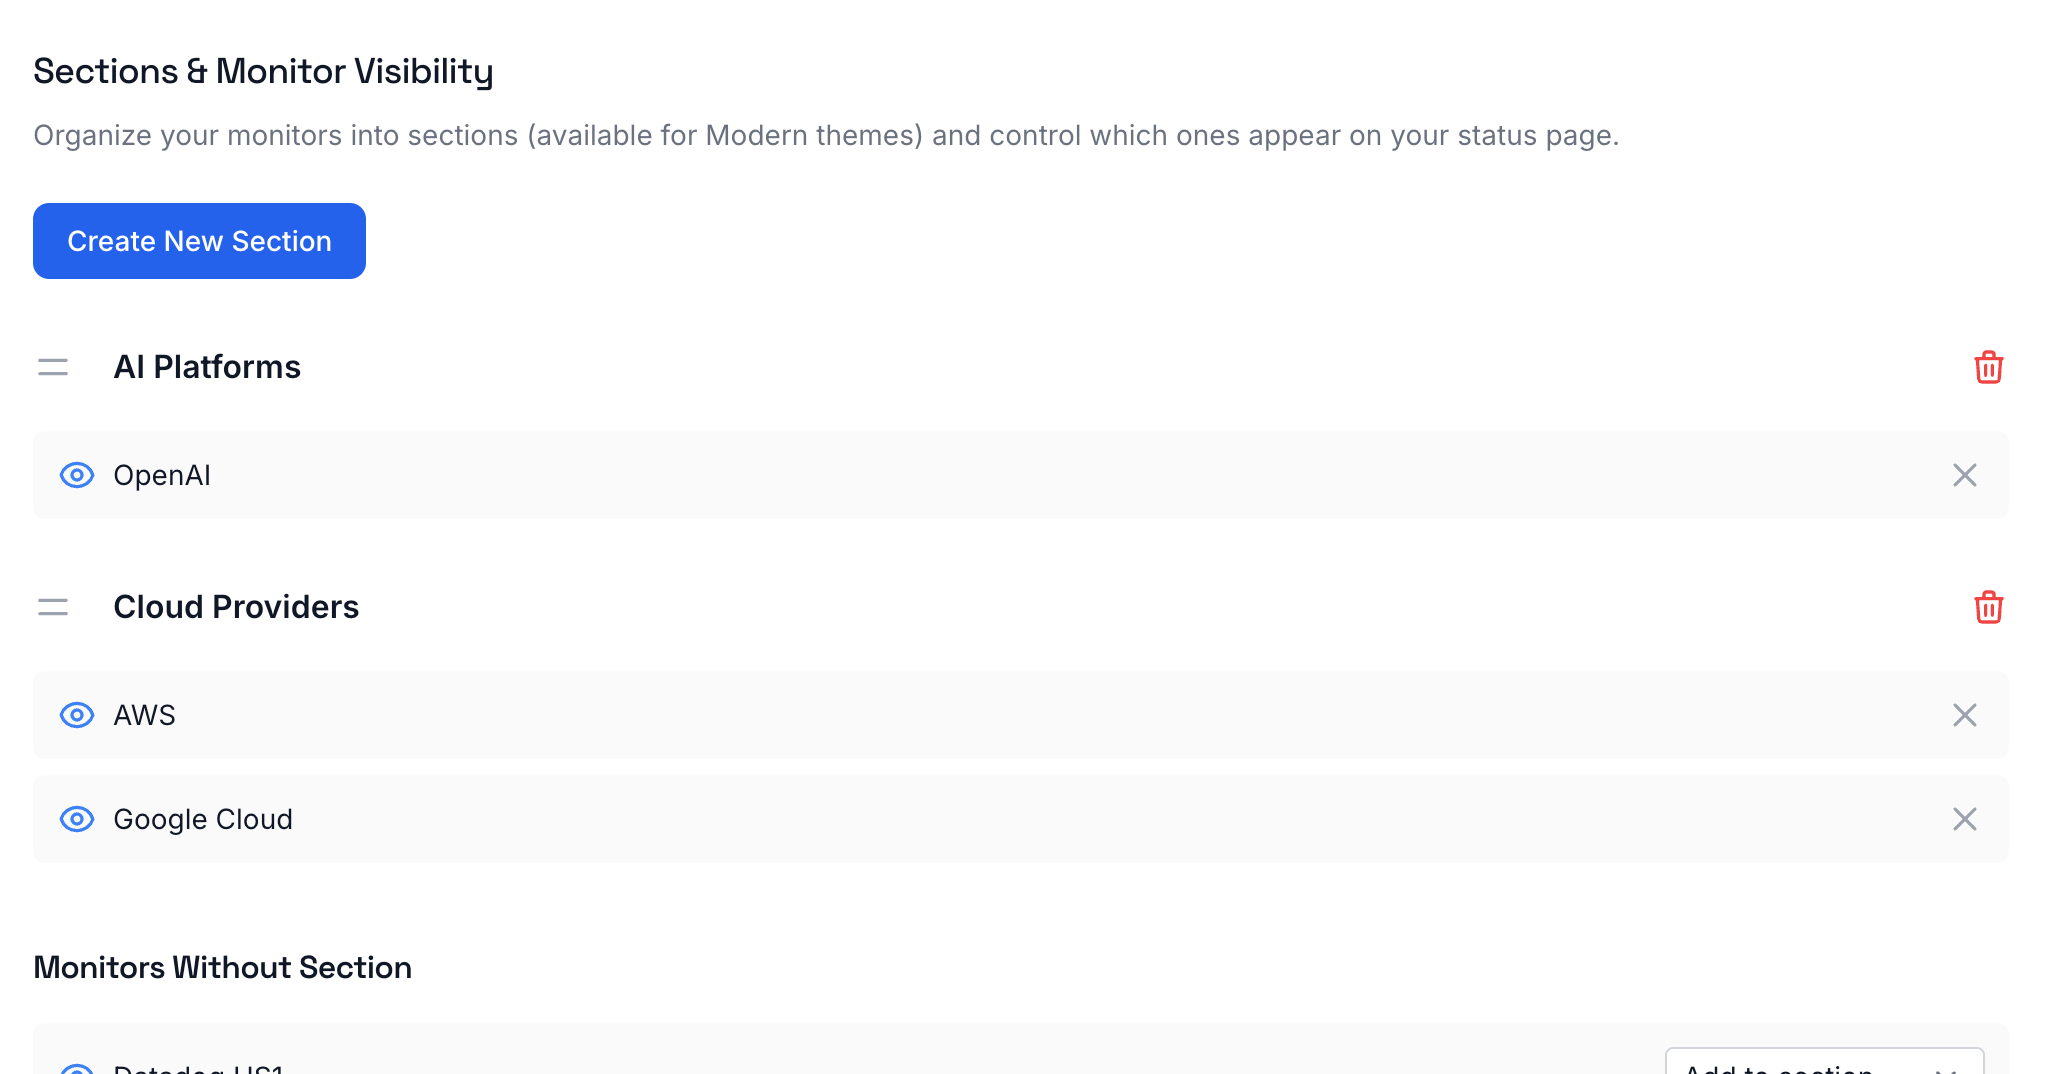
Your status page is getting a makeover. Now you can group related monitors under custom sections with headlines, perfect for teams with lots of services.
What's new:
-
Create, edit, and delete sections directly from your status page options
-
Drag monitors into sections to keep things organized (Webshops, Backend Services, External Providers, you name it)
-
Empty sections automatically hide from your live status page
-
Available in Modern themes
Your visitors can now quickly find the services they care about instead of scrolling through a wall of monitors.
👀 Control visibility of the services you want to showIn the same status page options tab, you can now choose which monitors and sections appear on your live status page. Hide internal services or anything else you don't want your visitors to see.
Status Pages got a lot better
Hi everyone!
Today, we're happy to share two new features in the Status Pages.
Show the components' statusNow your team and customers can see the current status of each service's components (services and regions) right from your status page.
To enable it, go to the Status Page > Customize Options and check the Show Components box.
If you're only monitoring specific parts of the service, it will only show those parts, not the full list of components.
Subscribers can select updates from specific servicesBefore, subscribers received all notifications in their emails. Now they can select only the services they want to receive updates from.
After they subscribe, they will also have access to a page where they can manage their subscription ( manage the services they want to monitor or unsubscribe )
Thank you, everyone, for the feedback!
If you have more, just let us know!